

By using this website, you agree to our Terms of Use (click here)
Hello,
I am working on a GI to create a calculation for inventory buffer levels based on average sales and current inventory. However, I am running into a problem trying to add inventory per item, where for some reason it completely changes the sales information.
Here are the tables I am using (before trying to add inventory information):

The relations of these tables are set up in the following way:
SOOrder > (Left) > BAccount (Parent CustomerID, child BAccountID)
SOOrder > (Left) > SOLine (Parent orderNbr, child orderNbr)
SOOrder > (Left) > Customer (Parent customerID, child bAccountID)
SOLine > (Left) > InventoryItem (Parent InventoryID, child InventoryID)
The only parameters are for start and end date based on SOOrder.OrderDate.
The conditions are the following:
Dates for parameters,
InventoryItem.ItemClassID Does Not Equal (four different values, one per line),
Customer.CustomerClassID Equals one value).
It is grouped and sorted by InventoryItem.InventoryCD
The Results Grid is the InventoryCD from InventoryItem, the OrderQty from SOLine, and a calculation dividing the sum of the order qty per sku by 120.
This is what I get with all of this information:
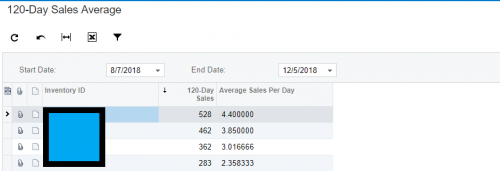
.
These are the correct sales figures for a 120 day period. Now, when I add the table [InLocationStatus], I relate it with the parent table of InventoryItem, with InventoryID for both tables as the parent and child, and this is what happens to my sales figures:
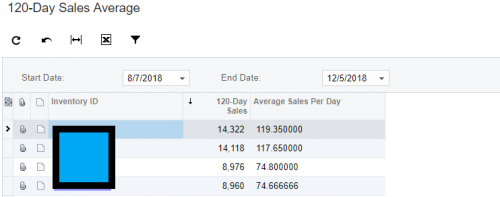
As you see, the exact same items become much larger numbers, and I'm not certain why. I've tried using the Aggregate Function with Count/Max/Sum, etc., but none of them have the same figures as the original without adding inventory information.
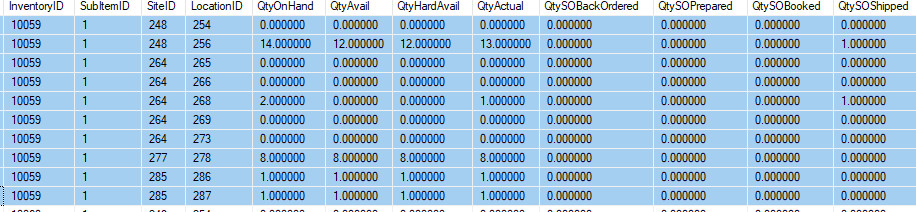
P.S. The reason I'm using [InLocationStatus] is because I need Qty Available, not Qty On Hand, etc. I need to know the exact quantity that's available for shipping, etc.
Thank you in advance.

I suspect it is because the Item Location Status table can have multiple rows per item. Therefore, if you have the item on the first row of your first example in multiple locations, you will have an over-inflated set of numbers in the second screen.

Agreed. How did you join to INLocationStatus?
@Brandon, if you have 5 of one item in location one and 10 of the same item in location 2, you will bring in a total count of 15. However, since there are two location records, my total sales for the item gets doubled. This, in turn, affects the other calculations.
I suspect you are going to have challenges putting everything you want into a single GI. If you were doing this in SQL, you would calculate your total on-hand/available quantities from the INLocationStatus table is a subquery and then use the results in your GI. However, this isn't possible in Acumatica. I suspect you will have to get your results possibly from a report with subreports or outside of Acumatica using data from multiple GIs.

I remember having an issue like this before where my totals were doubling, tripling or whatever due to a join of another table. I solved it by dividing the field i was aggregating by a constant value from the join table. So lets say my aggregate column was 5 times more than it should be, i divided the field by a constant in the join table which also had the value 5. Then when the amount was aggregated, the total was correct.
I know this is a bit of a hack and it very much depends on whether you can find a suitable field to divide your amount fields by - basically you are looking for a value which matches the total number of rows you are exploding your query by.
Ultimately I didn't end up using that Query as I found a totally different solution to my particular problem, but just thought I would throw it out there in case it helped.
Royce,
Good workaround, but I don't think it will work here because the number of InventoryLocation records will vary by Item so there isn't a constant number that can be used as the denominator.
Brandon,
Looking at this further, have you tried using INSiteStatus? That gives you one record per Warehouse/Item combination. Just make sure to join on both Warehouse and Item. I'm still not sure this will work though because you will wind up with QOH on every Sales Order line. Power BI actually handles this really well. You do one query to get all Item records, then you do two separate sub queries. First, get all order data. Second, get all QOH data. Then you relate the tables together and it knows to total the sub queries without any duplication of data.
Tim and I are on the same page. The number of records in the INLocationStatus more often than not will be dynamic based upon the number of locations defined in a warehouse and how many of those locations hold each item in the report.
Whether you use PowerBI, Excel with PowerQuery, or another data tool, the path is the same. You will preprocess the data from the INLocationStatus table (read summarize and calculate Qty Available) and then join the results with your other data. This will give you the insight I think you are looking for.


To solve the above problem I will group on the field then use an aggregate function such as MIN. If the value is the same in all fields, which it should be for repeating fields I get what I need.
This is the easiest way - and avoids all those nasty aggregation hacks.

Try this one..it was from pre 2021.2 but may be helpful